

If you’ve ever been in the business world, you’ve probably heard of KPIs. ‘KPI’ stands for Key Performance Indicator. These are the metrics that help businesses know if they are achieving their objectives. Examples include relative market share, net profit margin, and net promoter scores.
But you don’t need to be a business guru to get this concept. If you’ve ever watched a sporting event, you already implicitly understand it. During the breaks in the action, the commentators love to talk about the game “stats.” These are the underlying metrics that explain why a certain team is winning. For example, in basketball, you might look at rebounds, the percentage of made shots, turnovers, and fouls. Coaches use these indicators to help them know what to focus on in practice. “Try harder to win” is not a clear action plan. “Get more rebounds” has a clear definite objective.
When you think of your own health, you should use the same approach. It’s great that you have the goal to be healthy, but what are the KPIs that will help you know you are succeeding? If you are like most people, the indicator you’ve been most aware of is your body weight. The reason weight is the dominant measure is because it is easy to measure and it does have some predictive value. However, with just a bit more effort, there are other measures that are much more helpful in knowing how you are doing. So, instead of watching the scale, here are the six best health KPIs you should know about yourself.
1. Body Mass Index (BMI)
BMI is a commonly used metric in determining ideal body weight. It is widely used in the medical field as a quick indicator of possible health risks. Generally, the higher the BMI, the higher the chances you will suffer health problems from obesity, diabetes, and heart disease. Doctors use it to advise their patients of potential health problems, especially if there is a noticeable progressive increase in their BMI, and is currently the official metric for classifying individuals according to different obesity levels.
The limitation of BMI is that it doesn’t take into account body composition (i.e. the amount of fat vs muscle). So, in some cases (these are rare) someone who is very muscular will show a high BMI but will not actually be overweight (think bodybuilders and large athletes).
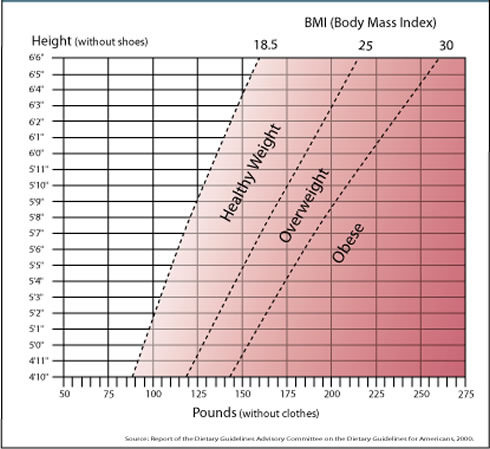
BMI is divided into ranges for a general assessment of body size: healthy (18.5-25), overweight (26-30), and obese (31+). Like I said, it’s a rough estimate, but it is something you should be conversant with since it is used so much in current healthcare. For a quick estimate, you could use the chart below to plot your height vs weight or use this link to an online calculator for a more precise result.
2. Waist-to-height Ratio
Waist-to-height ratio is defined as waist circumference divided by height (measured in the same units). To be considered in a healthy range, it should be less than 0.5. Unlike BMI, it accounts for the distribution of body fat.
People who carry excess abdominal fat (around the waist (think apple shape), have a far greater risk of health issues than people who carry the weight around the hips and thighs (think pear shape). This is because abdominal fat is situated around the internal organs like the heart, liver, spleen, and kidneys.
This so-called ‘visceral’ fat is associated with metabolic syndrome, diabetes, and heart disease. Several studies have shown this to be a more accurate predictor of life expectancy than BMI.
So grab that tape measure and measure just below the belly button. Then punch your results in here:
Calculate your Waist-to-Height Ratio
3. Body Fat Percentage
Body fat percentage is the measure of body fat relative to other body materials such as bone, muscle, and organs. It’s the holy grail of body composition analysis. Where BMI and waist-to-height ratio are rough approximations, a measure of body fat percentage cuts straight to the chase.
| Description | Women | Men |
|---|---|---|
| Essential fat | 10–13% | 2–5% |
| Very lean | 14–20% | 6–13% |
| Lean | 21–25% | 14–17% |
| Normal | 26–31% | 18–22% |
| Overweight | 32–39% | 23–29% |
| Obese | 40% + | 30% + |
While body fat percentage is probably the best body composition KPI, it is also the hardest to accurately measure without special equipment. The most accurate way to measure is through water or air displacement.
The BOD POD Body Composition System uses a pressurized fiberglass chamber to calculate the body volume.
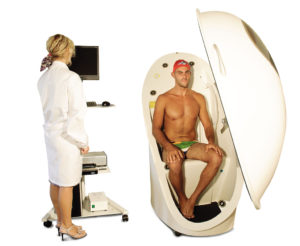
This method is called air-displacement plethysmography. Many universities or other health centers offer a low-cost analysis (around $20-$40). While this takes some time and effort to do, I think it’s worth it. Why? Because it’s the truest measure of how you are doing. Then you can see how it changes over time.
Here are three ways to get an idea:
- Look in the mirror for a ballpark estimate
- Use a calculator: Body Fat Percentage
- Find a Bod Pod near where you live: Bod Pod Near Me
4. Blood Lipids (Cholesterol)
Blood lipids are fat substances circulating in your blood, mainly fatty acids and cholesterol. The amount of these fats in your blood has direct consequences on your heart and circulatory health.
Think about it . . . the more “grease” in your blood, the more it can deposit on the walls of the vessels and in and around your vital organs.
No doubt you’re familiar with the “good cholesterol” (HDL) and the “bad cholesterol” (LDL) and triglycerides.
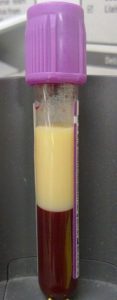
After sitting for 4 hours, the fat floats to the top of this test tube
A “lipid panel” is a blood test your doctor can order as part of a check-up, or you can order through a direct-to-consumer lab. The blood is drawn after a 12 hour fast.
| Total cholesterol | HDL cholesterol | LDL cholesterol | Triglycerides | |
| Good | Less than 200 | 40 or higher | Less than 100 | Less than 149 |
| Borderline | 200–239 | n/a | 130–159 | 150–199 |
| High | 240 or higher | n/a | 160 or higher | 200 or higher |
| Low | n/a | less than 40 | n/a | n/a |
5. Blood Glucose
Glucose is the body’s source of ready energy. Glucose is a molecule that is derived from short sugars (sucrose, maltose, and lactose) and strings of sugars called carbohydrates. When the body systems that control the use and storage of sugar fail, it’s called diabetes. A few young people get diabetes from a failure of the pancreas due to an autoimmune reaction (Type I). The vast majority get diabetes (Type II) after years and years of excess sugar/carbohydrates in the diet. Instead of ‘diabetes’, it should be called “sugar toxicity syndrome” since that’s really what it is.
When the body’s natural systems can’t deal with the high sugar anymore (i.e. it stays in the blood instead of getting absorbed into the cells), it becomes diabetes. When your blood has continuous high glucose, lots of other bad things start to happen including heart disease, kidney disease, nerve damage, and loss of eyesight.
The official definition of diabetes is when your fasting glucose is 126 mg/dL or greater on two separate tests. However, you are prediabetic when your fasting glucose in from 100-125 mg/dL.
Like the lipid panel, a fasting blood glucose level can be ordered as part of your routine check-up with your doctor or from a direct-to-consumer lab.
6. Blood Pressure
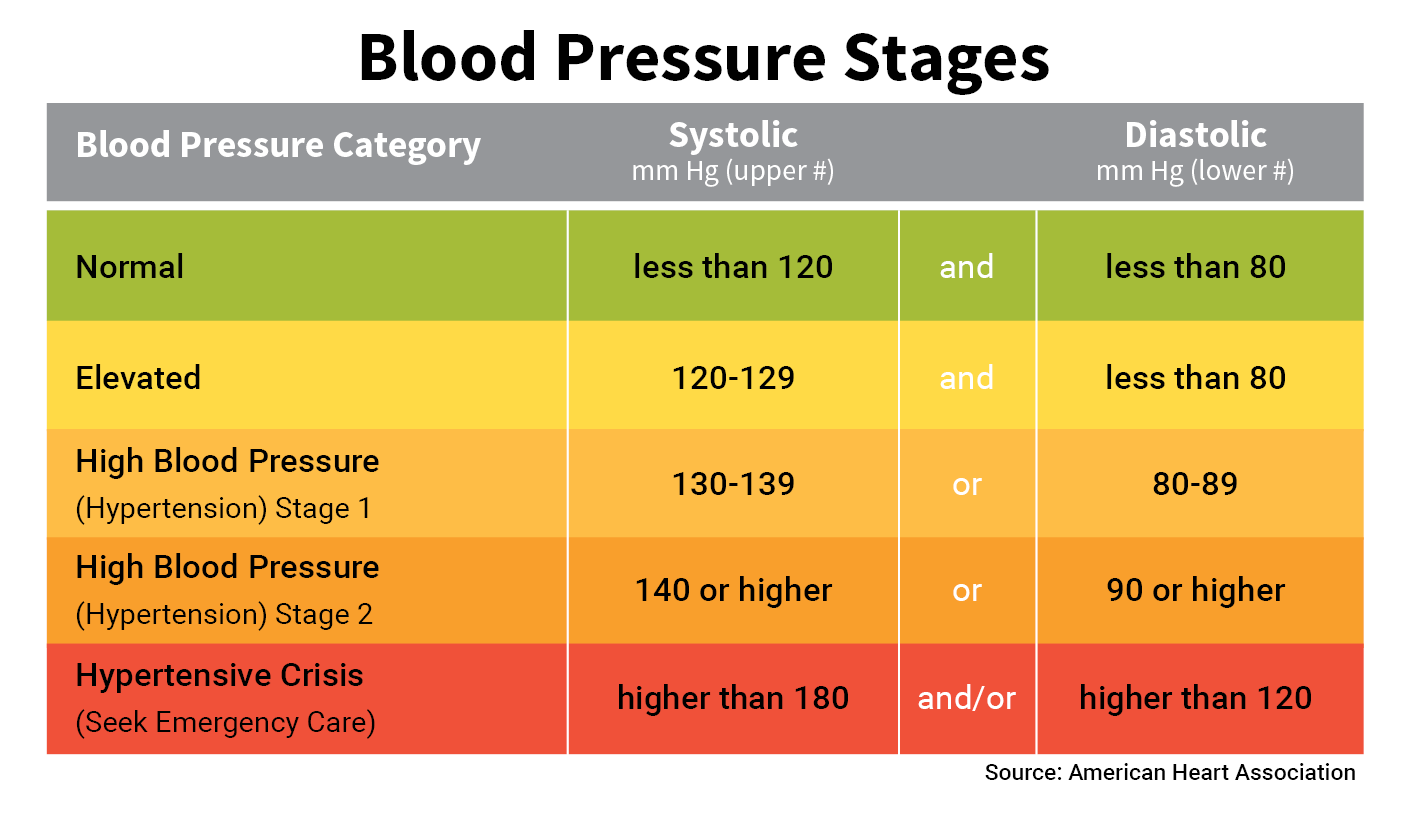
Blood pressure is pretty straightforward. It’s a measure of how hard your heart has to work and how much pressure is in the system. It’s not too hard to imagine that lower pressures are going to help your pump and the pipes last longer. The top number is the pressure while the heart is squeezing (systolic) and the bottom number is the pressure when the heart is relaxed (diastolic).
Many shopping malls, pharmacies, and grocery stores have machines that will measure your blood pressure. Since it can go up and down, you should measure it several times on different days to see what an average is.
So, in summary, these are the top health KPIs.
- BMI < 25
- Waist-to-height ratio < 0.5
- Body fat percentage: Men < 22; Women < 31
- Cholesterol HDL > 40
- Cholesterol LDL < 100
- Triglycerides < 149
- Fasting blood glucose < 100
- Blood pressure < 120 systolic and < 80 diastolic
Set a goal to know all these numbers by next week. Write them down. Know the score. If they are not what they should be for a long healthy life, then this is your wake up call.
This is your life and your body. It’s time to make a plan. You may want to make an appointment to see your doctor to review your status, but ultimately taking action to change is up to you. Remember that exercise and good nutrition will go a long way to “fixing” these metrics. You can change your future by starting today.
Consider high-intensity interval training (HIIT), it’s like a fountain of youth. Look into intermittent fasting, it can reset your metabolism. Cut out added sugar as much as possible, it may be hurting you more than you think.
What do you think? Do you know your numbers? Have you measured your fat percentage in a Bod Pod? What did you think? Share your comments below!

Thanks for the summary
You’re welcome.
Wise!
I set my health metric targets even higher to improve my health: BMI <=24, LDL<100, Total Cholesterol 150, bp 110/70. Those numbers aren't common but are achievable. I've done it. We can lower our risks of metabolic syndrome, DM, CAD, Ca, etc by behaviors alone.
Agree. Once you’re in the “good” range, don’t stop. As you say, there is good and better. I’m watching body fat as my best surrogate marker. To keep it near 12%, it “automagically” has fixed my cholesterol and blood pressure in lower ranges.